Introducing Rebalanced AI
Your numbers now come with context — a daily market briefing and an AI assistant that explains what your portfolio metrics actually mean.
Published May 24, 2026 • 5 min read
Open your portfolio and you might see something like: Return +18.3% · CAGR 14.1% · Beta 1.08 · Sharpe 0.91. Four numbers that are all technically correct — and individually, almost useless.
Is 18.3% good? Compared to what? Over what period? With how much risk? Is a Sharpe of 0.91 something to be proud of? New investors don't have any idea how to interpret the vast amount of metrics and ratios that are used to analyze a portfolio. Even more expereinced investors aren't fully equipped to make sense of it all, and the apps showing them these numbers don't bother explaining. We built Rebalanced AI to close that gap. Starting today, your data comes with context.
AI Market Briefing
Know what's happening before you look at your portfolio
On a continious basis, the AI scans market-wide data — index performance, sector performance, macro headlines — and distills it into a short plain-English briefing. Before you even open your holdings, you know what kind of day it's been and what's driving the moves. Never again will you look at your daily portfolio movement and day "Woah, whats going on today?".
It's not a news feed. It's not a list of headlines. It's a summary written to answer one question: what is actually happening in the market today, and what does it mean?
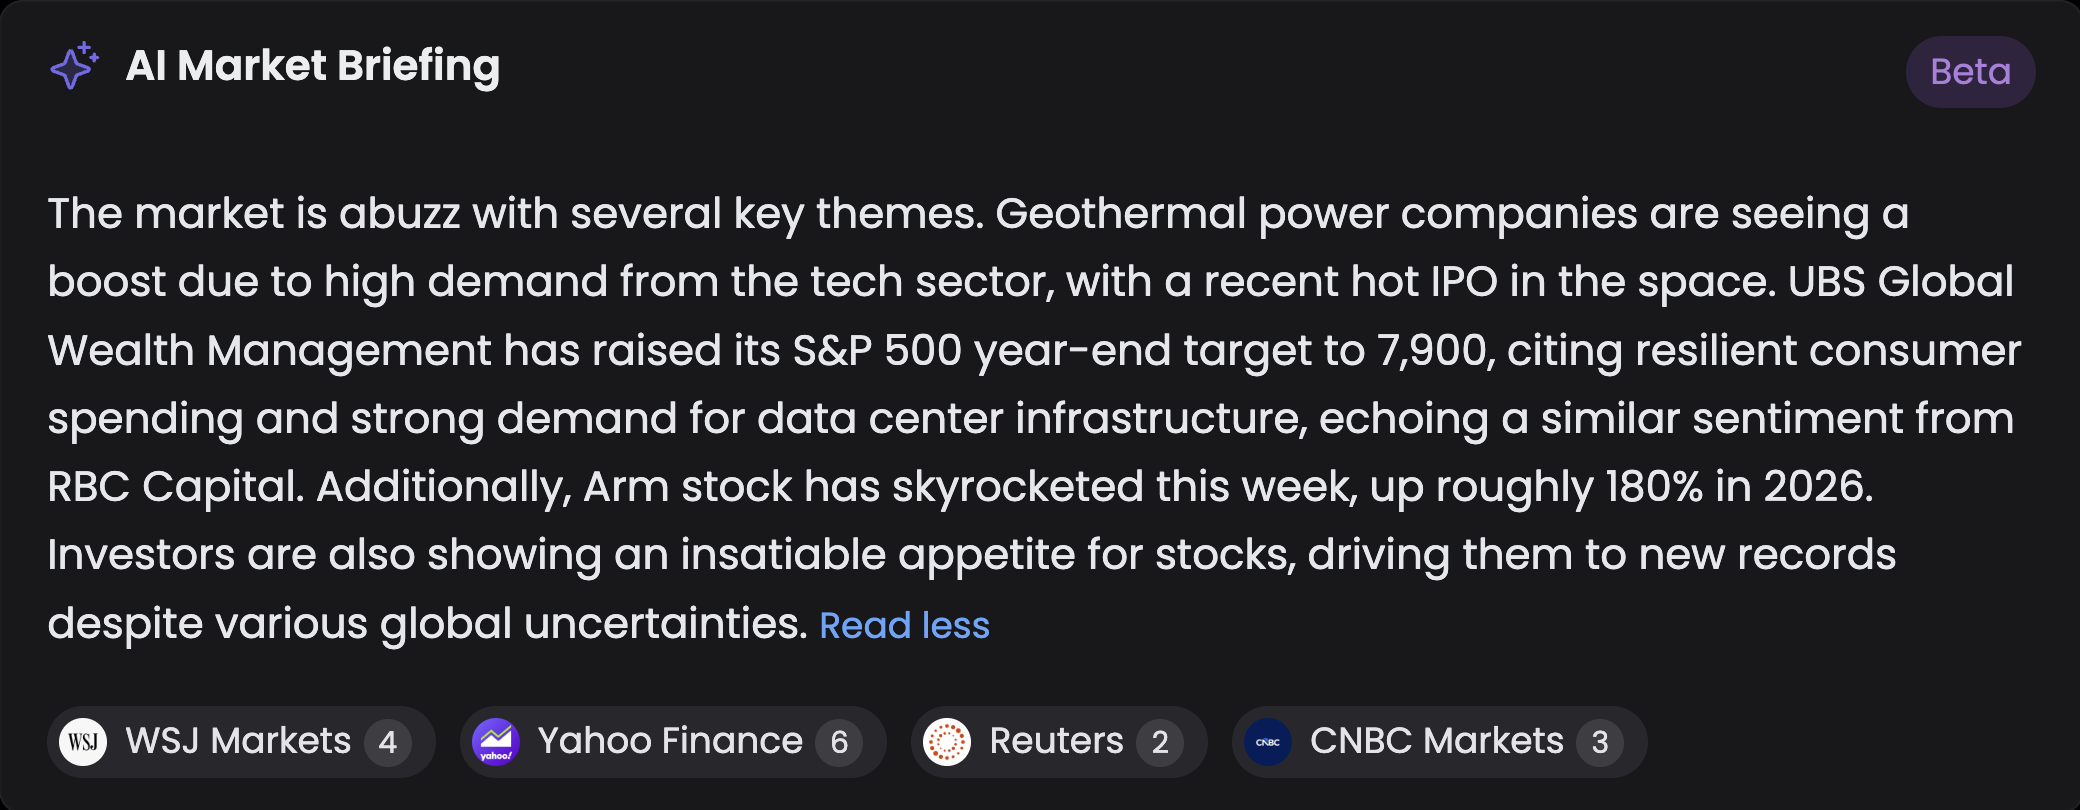
AI Market Briefing is available to all Rebalanced users — free and Investor tiers alike.
The AI Assistant
Ask anything. Get an answer that's actually about your portfolio
The AI Assistant lives inside the Rebalanced app and has full context of your connected accounts: your holdings, your return history, your benchmark comparisons, your backtest results. It's not a general-purpose chatbot. It knows your numbers, and it can explain them.
The two things we've seen users reach for most are the benchmark comparison and backtesting. Here's how both look in practice.
Putting your return in context
Rebalanced tracks your performance against the S&P 500 (and other benchmarks you choose). The assistant can walk you through the comparison — not just whether you're ahead, but what's actually driving it.
Year to date, your portfolio has returned +73.63% compared to the S&P 500's +9.34%. Your portfolio's alpha is +375.49%, with a Sharpe ratio of 6.10. The maximum drawdown for your portfolio was -36.91%.
Let's break down those numbers:
- Return: Your portfolio's total return this year is +73.63%, while the S&P 500 returned +9.34%. Your portfolio has significantly outperformed the benchmark year-to-date.
- Alpha: Your alpha is +375.49%. Alpha represents the return above what would be expected given your portfolio's level of risk. A positive alpha means you've generated returns beyond what the market alone would explain.
- Sharpe Ratio: Your Sharpe ratio is 6.10. This measures return per unit of volatility, above a 3% risk-free rate. Above 1.0 is generally considered good — above 2.0 is excellent. A 6.10 indicates very strong risk-adjusted returns.
- Max Drawdown: -36.91%. This is the largest peak-to-trough decline your portfolio experienced during the period. A less negative number is better — it indicates smaller losses during downturns.
These are real computed metrics from your connected accounts — the AI interprets numbers Rebalanced has already calculated, not estimates.
Running a backtest
Rebalanced has a full backtesting engine — you pick the assets and weights, it runs the historical simulation. The assistant makes it easier to kick one off: just describe what you want to test, and it configures the parameters and starts the run.
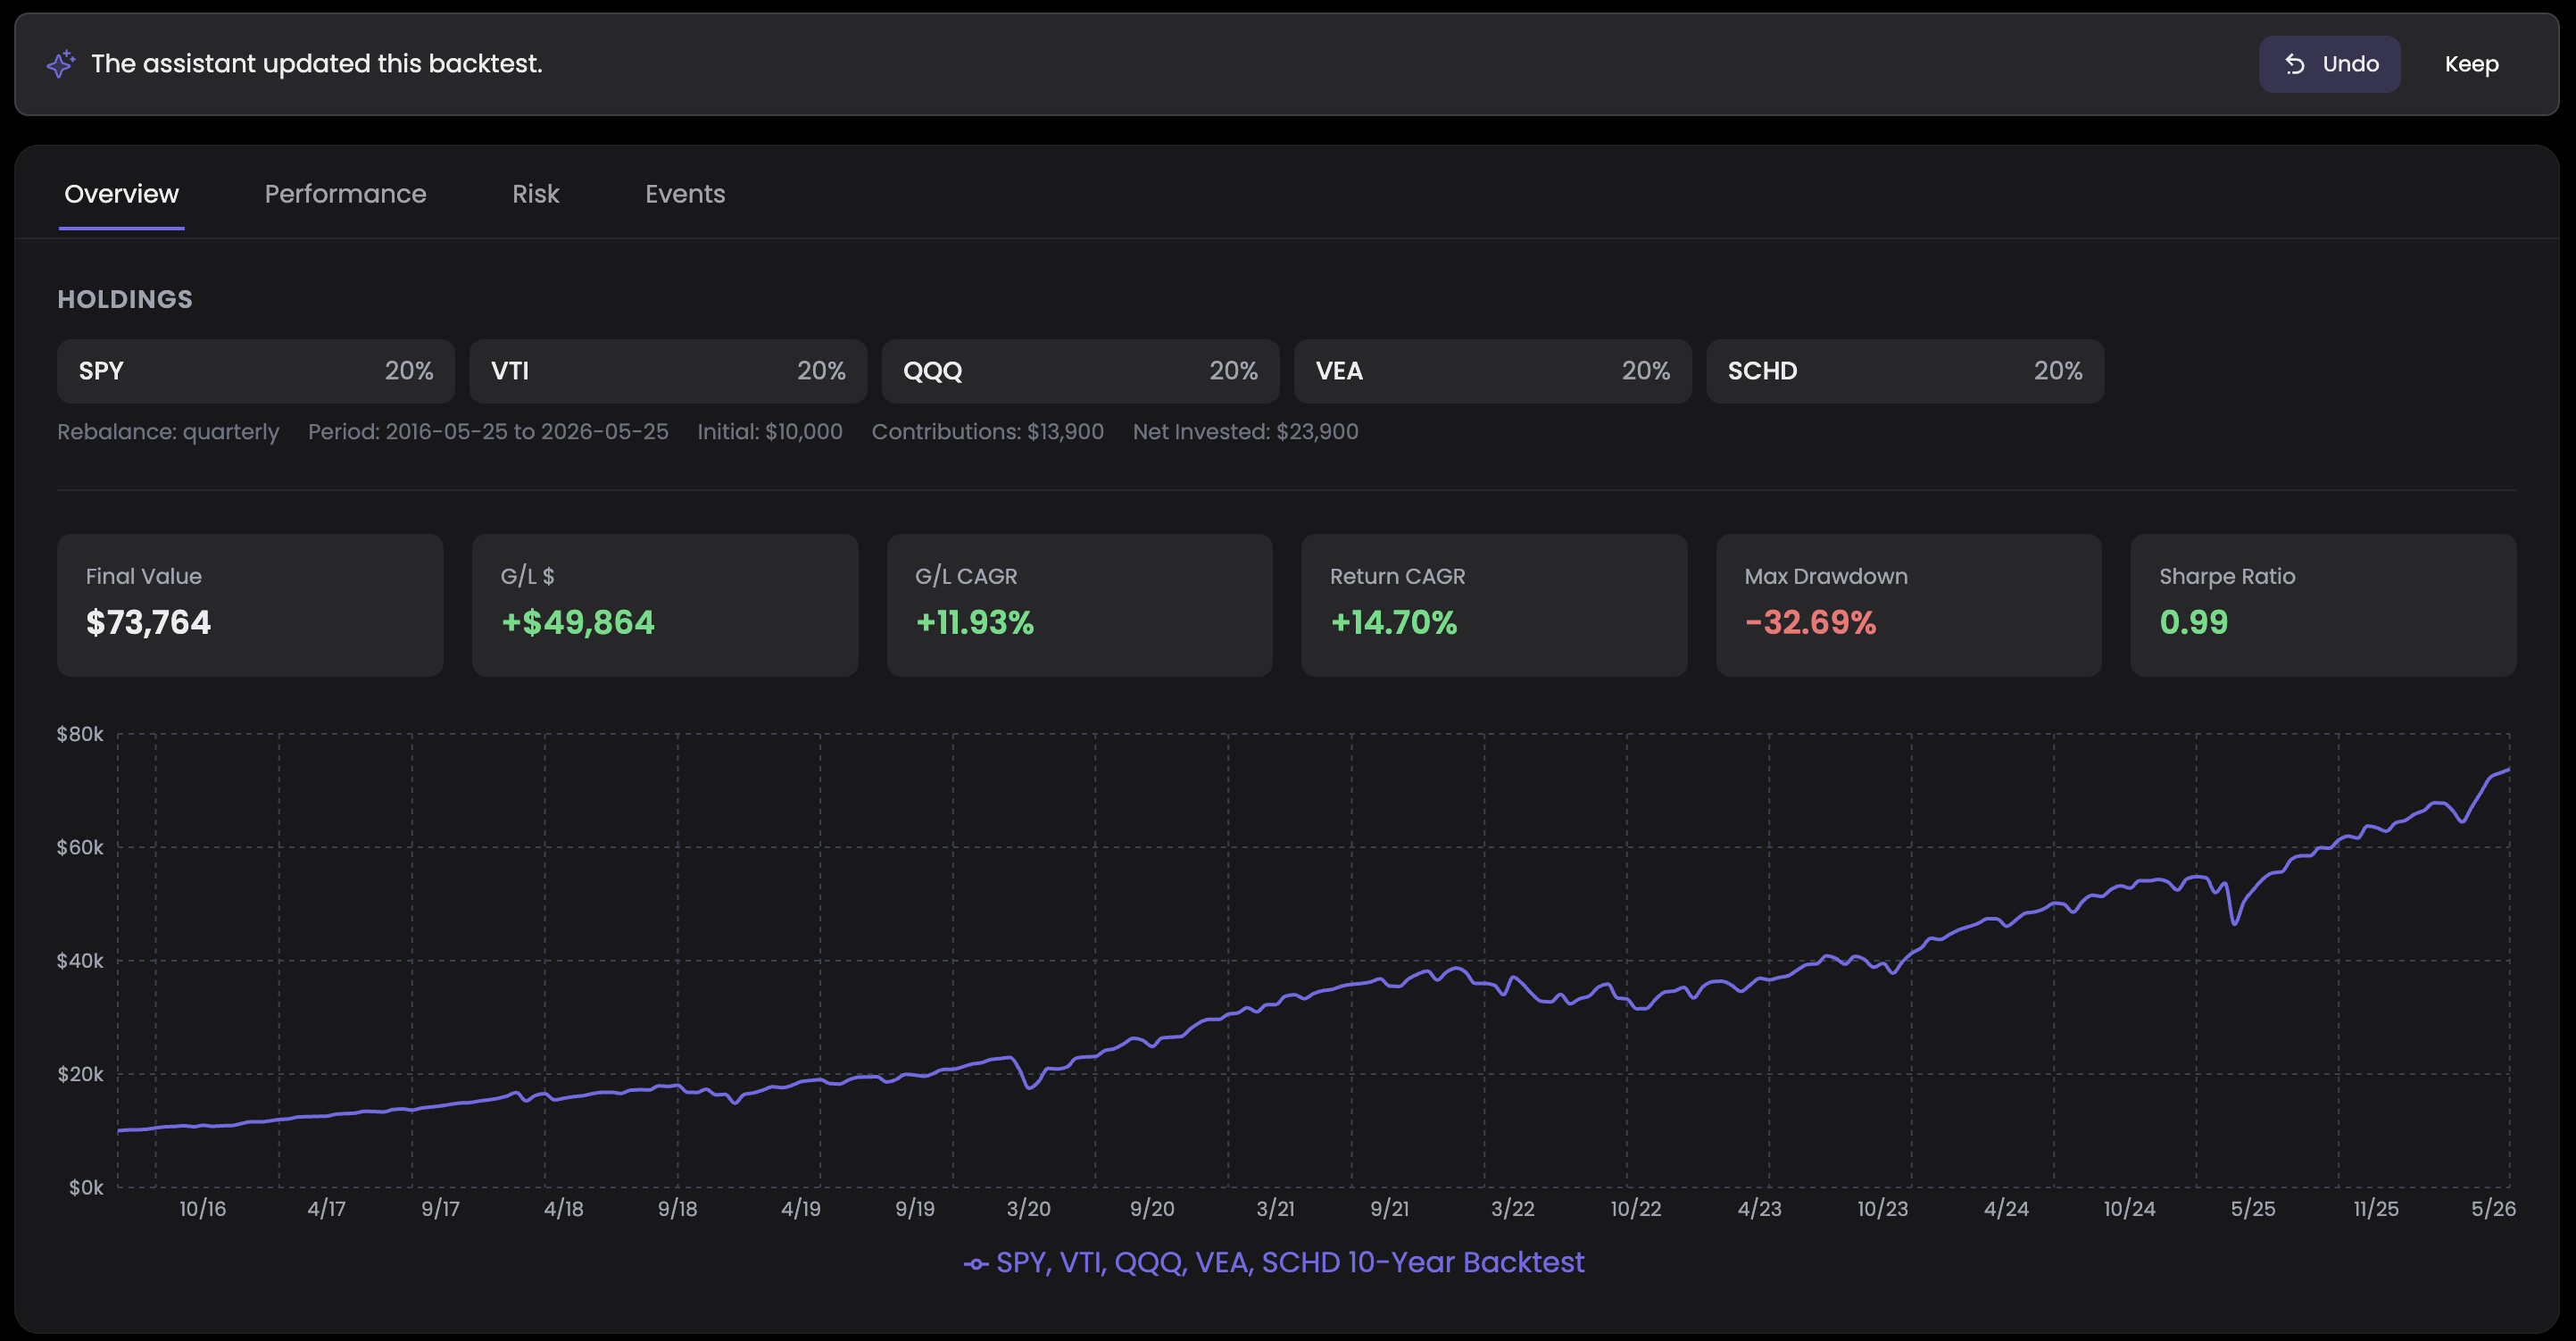
I've created a new backtest called "SPY, VTI, QQQ, VEA, SCHD 10-Year Backtest" with an initial value of $10,000, rebalanced quarterly. Here's a summary of its performance:
- CAGR: 15.24%
- Total Return: 313.05%
- Max Drawdown: -32.69%
- Sharpe Ratio: 0.65
I've updated the backtest to include a $100 monthly deposit. You can undo this change from the banner on your screen.
With the monthly deposits, the backtest now shows:
- CAGR: 14.64%
- Total Return: 291.82%
- Max Drawdown: -32.69%
- Sharpe Ratio: 0.93
I've updated the backtest to include an opportunistic buy of $1,000 when the portfolio has a 20% drawdown. You can undo this change from the banner on your screen.
With the opportunistic buys, the backtest now shows:
- CAGR: 14.70%
- Total Return: 294.09%
- Max Drawdown: -32.69%
- Sharpe Ratio: 0.99
All of the AI driven backtesting can be saved along side your other backtesting strategies so you can revisit them later.
Availability
| Feature | Status | Who can access |
|---|---|---|
| AI Market Briefing | Beta | All users — free and Investor |
| AI Assistant (Chat) | Beta | Investor tier subscribers |
Numbers are a start. Context is what makes them useful.
Both features are live now. Open Rebalanced, find the AI tab, and ask it something. We think the first time it explains one of your metrics back to you in plain English — you'll get why we built this.